Discriminating patterns and making connections …
This is how Andrew described the work of science as I left the lab after my third day in the University of Sheffield Department of Physics.
This is not so very different to the work of art I think – at least on one level …
The topic that had taken up most of our discussions that day – a topic which had leaped out at me during my second visit to the department (during which I attended a frankly rather mind-boggling meeting of the Structural Colour research group) was centred around ideas of visualisation. Or perhaps to put this another way, about the visualisation of ideas: how we apprehend or understand an idea when that idea is situated at the limits of visibility. An idea about colour that operates at a scale thousands of times smaller than the width of a human hair …
What had struck me in the meeting, during which we looked at numerous images of nanostructures*, was the need to create various graphic representations to support research findings around these tiniest of apprehensible forms. Graphic representations from a variety of different points of view, or using various conceptual spaces**. I say findings, perhaps I should really say investigations or ‘seekings’. Sometimes that is being sought, but which has not yet necessarily been found. Correlations might not yet align as neatly as might be hoped, data might be dispersed rather than helpfully clumped together in appreciable nodes.
Adam, another researcher, has described this process as being something like looking for a needle in a haystack. A quite appropriate analogy when we think of the similarity in shape and diameter between a metal needle and a stalk of hay … or between the linear, nanoscopic ridges and canyons making manifest those beautiful, vibrant colour sensations through the diffraction of light making its passage across the surface of a butterfly’s wing …
Adam had presented a number of graphic representations based on the location of structural colour within the wings of various Heliconius butterflies at that mind-boggling meeting. Adam is seeking patterns and connections between the structures that generate colour in the wings of various South American species of this gem-like insect, which might lead to a better understanding of genetic connections between individuals and sub-species. The information supporting these connections was presented first as electron micrographs of the physical nanostructures, then in the form of a ‘correlation matrix’ that resembled a kind of tartan rug of interwoven data, and finally as a ‘network graph’ consisting of lines of various thickness denoting the similarity between specimens. The thicker the line, the broader the basis of connection. All very mathematical but fairly easy to understand in terms of imagery, without the need for words or complex definitions.
Each representation helps to create a broader mental picture or apprehension of these connections, correlations, suggestions of patterns. A kind of understanding emerges not as an image as such but as a multi-faceted mental form that can be apprehended or ‘seized’. Only through a combination of words, pictures and mathematics can these slippery ideas be held frozen for long enough to be properly examined for evidence of truthfulness.
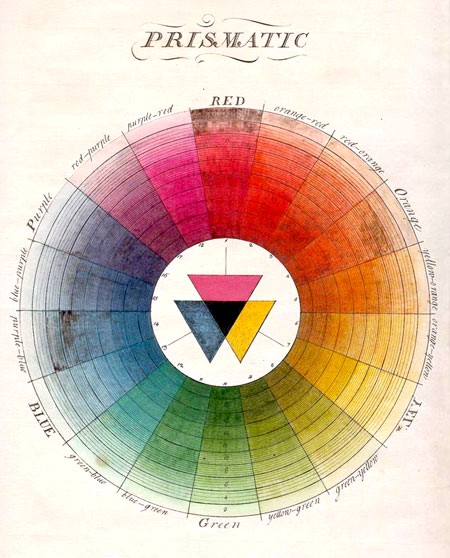
My ideas of colour on the human scale are currently becoming increasingly fluid, increasingly slippery, as I struggle to create a new artistic understanding based on the overwhelming amount of scientific knowledge, and the dizzying array of potential viewpoints and graphic representations of colour phenomena that I am currently absorbing. The truthfulness of colour, which once seemed so plain, is becoming increasingly subject to question.
Still, at least I’m starting to get a better understanding of the basic components of what I’m looking at …
I think that this is another aspect of the work of both science and art, to examine things in their component form (in the case of a drawing we might think of lines, tones and composition) in order to handle these components confidently enough to experiment with simple configurations. In some ways this is the task of abstract painting – although we might need to come back to the spiritual element of that grand artistic enterprise at a later date.
Later, as Andrew and I looked at various spectrographs of the artist’s quality Cadmium Red and Vermilion that I had brought into the lab for analysis, I made a simple note in my journal – ‘what is that I’m looking at here … what exactly is it that I’m looking for?’
*A nanostructure is a structure of intermediate size between microscopic and molecular structures.
** With regards to these ‘conceptual spaces’, we also talked about the Fourier transform: a complex mathematical procedure where the mapping of a function, as a signal that is defined in one domain as space or time, is transformed into another domain as wavelength or frequency represented in terms of sines and cosines. This is not so easy to understand so I hope to return to it later when I discuss the different ‘spaces’ in which colour can be perceived and how I hope to represent them creatively.
